By: Alex Carrick on
Sidebar Casualty of the Coronavirus Crisis – Mega Projects
ConstructConnect announced today that the latest month’s volume of construction starts, excluding residential work, was $28.6 billion (green shaded box, Table 4 below), down nearly one-quarter (-23.1%) versus June’s figure of $37.2 billion (originally reported as $37.6 billion).
July 2020 nonresidential starts versus July 2019 were a jaw-dropping -44.0%. Measures to combat COVID-19 have not only depressed general economic activity, including new construction undertakings, they have seriously suppressed go-aheads for mega projects (i.e., jobs valued at $1 billion or more each).
There was only one mega project start-up in July of this year ‒ $1.4 billion in rapid transit work in San Dimas California, east of Las Angeles (see Top 10 Project Starts in the U.S. – July 2020). Year to date in 2020, there have been only five mega project groundbreakings, summing to $9.45 billion. In July of last year alone, four mega projects were green-lighted for a combined $8.7 billion. (The largest was the Calcasieu Pass LNG facility in Louisiana, $4.5 billion).

View this information as an infographic.
A recovery in starts is sure to gain momentum as 2020 wanes and a fresh new year, 2021, begins to unfold. It seems unlikely, however, that 2019’s strength in mega projects will be duplicated anytime soon. The first seven months of 2019 featured 19 mega projects totaling $45.0 billion. Full-year 2019 included 35 mega project start-ups adding to $79.1 billion. To demonstrate how unique 2019 was for mega projects, 2018 saw just 20 such initiatives for $47.2 billion.
In 2020 year-to-date starts, the privately-financed categories of construction have been weakest—commercial, at -34.6%, and industrial, -77.5%—while public/government works have fallen into shallower pits—institutional, -15.0%, and engineering, -9.4%.
Q2’s Unprecedented Quarterly GDP Drop
As Graph 1 clearly illustrates, there’s been nothing like 2020’s Q2 gross domestic product collapse (-32.9% quarter to quarter annualized) in the history of data compiled by the Bureau of Economic Analysis (BEA) dating back to 1947. The second worse result was -10.0% (less than one-third as steep) in Q1 of 1958.
The decline in economic activity in the Spring of this year became most apparent in the jobs market. March-April’s combined drop in total employment was a staggering -20.5 million positions. Since April, 7.6 million jobs have been recovered, although it has been a struggle. Lockdowns in many states were gradually eased, but re-openings also allowed the coronavirus to spread more easily, especially in the South and West of America. A 4.8-million-jobs surge in total employment in June shrank to 1.8 million in July.
Since 1947 (i.e., Beginning of BEA data)
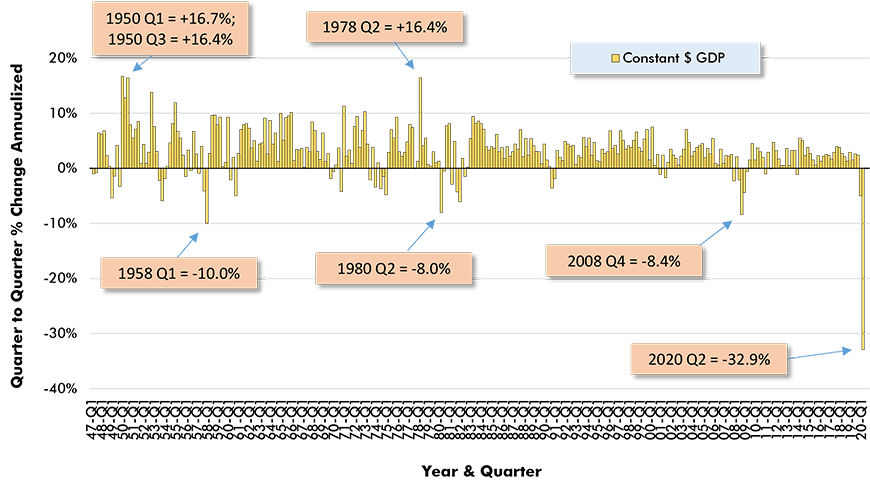
Chart: ConstructConnect.
Construction Among Leading Sectors for Jobs Retention
The far-right column in Table 1 records jobs recovery ratios, also referred to as ‘claw-back’ ratios, for the total economy and key industrial sectors. The claw-back ratio is the number of jobs reinstated through July versus April divided by March-April’s ‘big drop.’ Economy-wide, a little more than one-third (37.3%) of the severe early-Spring jobs loss has been retrieved. Among industrial sectors, construction has the second-best record, with a claw-back ratio of 54.5%, trailing only retail trade, 56.7%.
Worth noting, though, is that construction’s jobs gain in the standalone month of July was only +20,000 compared with the +1.8 million employment climb for the entire economy. Also know that the weighting of construction’s July jobs increase was entirely towards residential work, with nonresidential staffing modestly declining.
Table 1: Monitoring the U.S. employment recovery ‒ July 2020
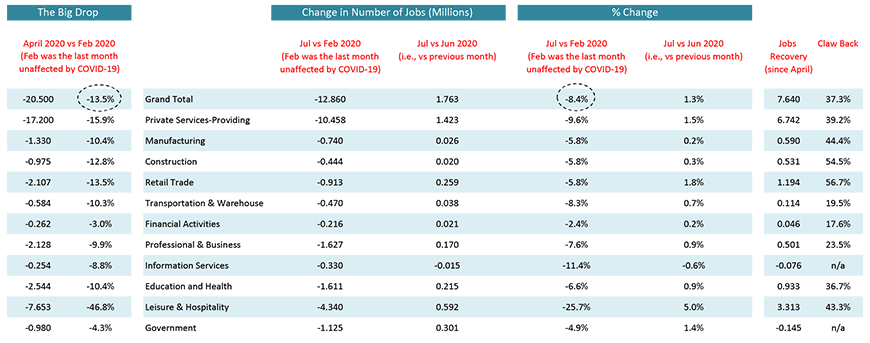
Chart: ConstructConnect.
As for construction employment presently compared with a year ago, Graph 2 highlights that the sector is doing comparatively well. Again, it’s in second place, at -4.1% y/y, this time behind only financial services, -1.4%. Manufacturing jobs are -5.7% y/y; ‘total’ employment is -7.5%. Standing out for its extraordinary degree of jobs distress it the ‘leisure and hospitality’ sector, with employment at -24.2% (or nearly minus one-quarter) year over year.
Graph 2: Y/Y Jobs Change, U.S. Total Industry & Major Subsectors − July 2020 (based on seasonally adjusted payroll data)
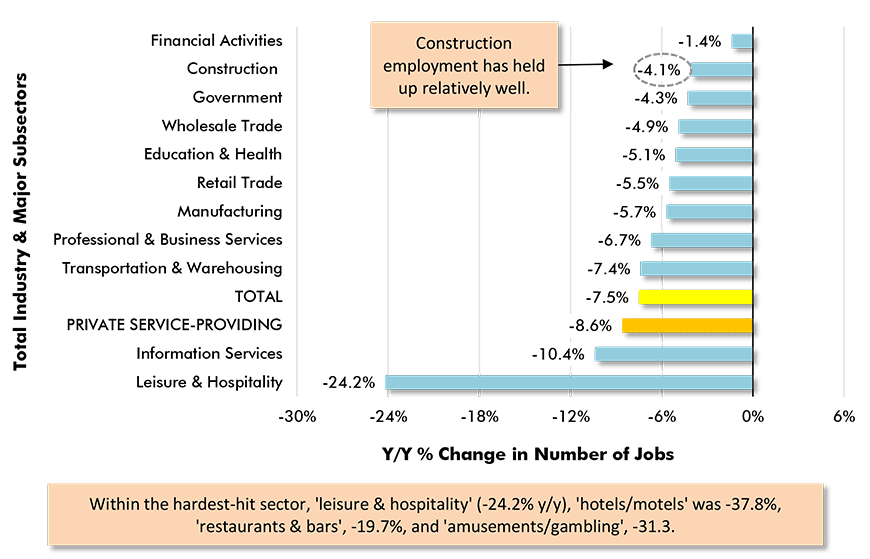
Chart: ConstructConnect.
U.S. construction’s not seasonally adjusted (NSA) unemployment rate in July was 8.9%, better than June’s 10.1% and vastly superior to April’s 16.6%. Of course, a year ago, in July 2019, it had been much tighter, at only 3.8%.
Engineering Starts Have Been Least Cringeworthy During Pandemic
July’s nearly one-quarter (-23.1%) pull-back in total nonresidential starts compared with June (m/m) originated mainly in the institutional type-of-structure category (-35.3%), with commercial (-22.6%) and heavy engineering/civil (-17.9%) also failing to provide any support. Only industrial managed an uptick (+107.2), but it was achieved on top of a low base figure. Still, it’s noteworthy that industrial in July included a Subaru car plant expansion in Tippecanoe County, Indiana.
July 2020’s -44.0% performance of total nonresidential construction starts relative to July 2019 (y/y) resulted from all four type-of-structure categories being in the hole: industrial, -88.2%; commercial, -59.5%; institutional, -35.8%; and engineering, -14.8%.
The one-quarter (-25.5%) year-to-date decline in July was also a joint ‘effort’ by all type-of-structure categories, with industrial -77.5%; commercial, -34.6%; institutional, -15.0%; and engineering, -9.4%. (The ytd percent changes are for Jan-Jul 2020 versus Jan-Jul 2019.)
An Occasional Ray of Light in Year-To-Date Starts
The ‘school/college’ subcategory within institutional has accounted for the largest dollar volume of total nonresidential starts so far in 2020. The three percentage-change metrics for education facilities have been: -40.5% m/m; -19.2% y/y; and -14.7% ytd.
Usually important within institutional are health care starts. Presently, though, the medical facility designation, as the combination of ‘hospital/clinic,’ ‘nursing/assisted living,’ and ‘miscellaneous medical,’ lies comatose on a gurney: -40.8% m/m; -76.5% y/y; and -39.1% ytd.
Second behind schools for dollar volume of starts within total nonresidential so far this year is the subcategory ‘road/highway.’ Street starts have maintained good momentum on a year-to-date basis (-2.6%), although in July they were -18.8% m/m and -26.1% y/y.
Within commercial starts, the major subcategories were all down significantly year to date in July (‘hotel/motel,’ -45.8%; ‘private office building,’ -39.2%; and ‘retail/shopping,’ -32.1%), except for ‘warehouse,’ where the pullback was to a minor degree (-2.4%).
Only four subcategories of nonresidential starts have been positive on a year-to-date basis. One is within commercial (‘laboratory,’ +11.5%) and three are within institutional (‘library/museum,’ +17.6%; ‘fire/police/courthouse/prison,’ +13.4%; and ‘military,’ +154.6%). Only ‘military’ has also had gains both m/m (+39.8%) and y/y (+107.3%).
Mention should also be made of ‘water/sewage’ starts which were almost flat year to date in July (-0.2%), although they were -20.9% m/m and -10.9% y/y.
Not All Trend Graphs Committed to Deep Slide
All the twelve-month moving average trend lines in the first four graphs (Nonresidential Construction Starts Trend Graphs – July 2020) are displaying downward shifting tendencies. ‘Private office buildings’ and ‘retail’ are in the most distress. The engineering subcategory trend lines (Graphs 5 and 6) aren’t as obviously committed to deep slides. ‘Bridges’ and ‘miscellaneous civil’ appear to be hovering to see what will come next. The ‘roads/highways’ designation has been knocked off its stride only in the latest month and ‘water/sewage’ is keeping its composure.
Compensation for Construction Workers Remains So-So
Tables B-3 and B-8 of the monthly Employment Situation report record average hourly and average weekly wages for industry sectors. B-3 is for all employees (i.e., including bosses) on nonfarm payrolls. B-8 is for ‘production and nonsupervisory personnel’ only (i.e., it excludes bosses). For ‘all jobs’ and construction, there are eight relevant percentage changes to consider.
From Table B-3 (including supervisory personnel) ‘all-jobs’ earnings y/y in July were +4.8% hourly and +5.4% weekly. Construction workers weren’t so fortunate: +3.2% hourly and +2.7% weekly. From Table B-8 (excluding bosses), the ‘all jobs’ pay increases were +4.6% hourly and +6.2% weekly. Again, construction workers didn’t catch the slipstream: +3.0% hourly and +2.4% weekly.
3 PPI Construction Costing Series ‒ 2 Advances; 1 Retreat
July 2020’s y/y results for three BLS Producer Price Index (PPI) series were as follows: ‘construction materials special index,’ +0.2% (up from June’s -0.5%); ‘inputs to new construction index, excluding capital investment, labor, and imports,’ -0.3% (less negative than June’s -1.5%); and ‘final demand construction,’ +2.1% (down from June’s +2.2%).
The value of construction starts each month is derived from ConstructConnect’s database of all active construction projects in the U.S. Missing project values are estimated with the help of RSMeans’ building cost models. ConstructConnect’s nonresidential construction starts series, because it is comprised of total-value estimates for individual projects, some of which are super-large, has a history of being more volatile than many other leading indicators for the economy.
‘Grand Total’ Starts -20.4% YTD
From Table 4 below, ConstructConnect’s total residential starts in July were -13.0% m/m, -20.6% y/y, and -11.0% ytd. The latest month’s multi-unit starts were -21.4% m/m, -34.3% y/y, and -22.0% ytd. Single-family starts were -10.3% m/m, -15.8% y/y, and -6.2% ytd. Combining residential and nonresidential, ‘Grand Total’ construction starts in July 2020 were -19.3% m/m, -36.3% y/y, and -20.4% ytd.
ConstructConnect has moved to a better-targeted and research-assigned ‘start’ date. (Prior to January 2017, the ‘start’ date was recorded as occurring within 30 to 60 days of the announced bid date.) In concept, a ‘start’ is equivalent to ground being broken for a project to proceed. If work is abandoned or rebid, the ‘start’ date is revised to reflect the new information.
Click here to download the Construction Industry Snapshot Package – July 2020 PDF.
Click here for the Top 10 Project Starts in the U.S. – July 2020.
Click here for the Nonresidential Construction Starts Trend Graphs – July 2020.
TABLE 2: VALUE OF UNITED STATES CONSTRUCTION STARTS
JULY 2020 – CONSTRUCTCONNECT
| % CHANGE | % CHANGE | % CHANGE | ||||
| JAN-JUL 20 | JAN-JUL 20 VS | JUL 20 VS | JUL 20 VS | |||
| ($ BILLIONS) | JAN-JUL 19 | JUL 19 | JUN 20 | |||
| Hotel/Motel | 7.143 | -45.8% | -49.7% | 58.9% | ||
| Retail | 7.252 | -32.1% | -26.2% | -11.6% | ||
| Parking Garage | 1.077 | -50.4% | -74.3% | -36.6% | ||
| Amusement | 3.683 | -20.8% | -74.6% | -39.7% | ||
| Private Office | 12.120 | -39.2% | -73.6% | -40.8% | ||
| Government Office | 5.878 | -12.2% | -44.9% | 11.8% | ||
| Laboratory | 1.232 | 11.5% | 59.1% | -11.5% | ||
| Warehouse | 12.263 | -2.4% | -44.8% | -55.5% | ||
| Miscellaneous Commercial* | 4.188 | -67.6% | -74.9% | 6.8% | ||
| COMMERCIAL (big subset) | 54.836 | -34.6% | -59.5% | -22.6% | ||
| INDUSTRIAL (Manufacturing) | 7.884 | -77.5% | -88.2% | 107.2% | ||
| Religious | 0.886 | -23.5% | -44.0% | -17.0% | ||
| Hospital/Clinic | 6.460 | -39.5% | -84.0% | -48.3% | ||
| Nursing/Assisted Living | 3.422 | -43.5% | -61.1% | -28.9% | ||
| Library/Museum | 2.770 | 17.6% | -52.3% | -24.3% | ||
| Police/Courthouse/Prison | 3.939 | 13.4% | 7.4% | -9.7% | ||
| Military | 5.350 | 154.6% | 107.3% | 39.8% | ||
| School/College | 43.515 | -14.7% | -19.2% | -40.5% | ||
| Miscellaneous Medical | 3.738 | -33.5% | -56.9% | -34.9% | ||
| INSTITUTIONAL | 70.081 | -15.0% | -35.8% | -35.3% | ||
| Miscellaneous Nonresidential | 3.082 | -24.2% | -38.6% | -23.8% | ||
| NONRESIDENTIAL BUILDING | 135.882 | -33.9% | -57.3% | -27.4% | ||
| Airport | 3.420 | -21.7% | -22.9% | -9.4% | ||
| Road/Highway | 40.511 | -2.6% | -26.1% | -18.8% | ||
| Bridge | 15.249 | -21.8% | -14.4% | -36.9% | ||
| Dam/Marine | 4.688 | -7.5% | -23.2% | -35.8% | ||
| Water/Sewage | 18.686 | -0.2% | -10.9% | -20.9% | ||
| Miscellaneous Civil (power, pipelines, etc.) | 14.525 | -18.7% | 43.1% | 22.4% | ||
| HEAVY ENGINEERING (Civil) | 97.079 | -9.4% | -14.8% | -17.9% | ||
| TOTAL NONRESIDENTIAL | 232.960 | -25.5% | -44.0% | -23.1% |
*Includes transportation terminals and sports arenas.
Source: ConstructConnect Research Group and ConstructConnect.
Table: ConstructConnect.
TABLE 3: VALUE OF UNITED STATES CONSTRUCTION STARTS
CONSTRUCTCONNECT INSIGHT VERSION – JULY 2020
Arranged to match the alphabetical category drop-down menus in INSIGHT
| % Change | % Change | % Change | ||||||
| Jan-Jul 20 | Jan-Jul 20 vs | Jul 20 vs | Jul 20 vs | |||||
| ($ billions) | Jan-Jul 19 | Jul 19 | Jun 20 | |||||
| Summary | ||||||||
| CIVIL | 97.079 | -9.4% | -14.8% | -17.9% | ||||
| NONRESIDENTIAL BUILDING | 135.882 | -33.9% | -57.3% | -27.4% | ||||
| RESIDENTIAL | 147.984 | -11.0% | -20.6% | -13.0% | ||||
| GRAND TOTAL | 380.944 | -20.4% | -36.3% | -19.3% | ||||
| Verticals | ||||||||
| Airport | 3.420 | -21.7% | -22.9% | -9.4% | ||||
| All Other Civil | 12.342 | 11.9% | 129.1% | 36.1% | ||||
| Bridges | 15.249 | -21.8% | -14.4% | -36.9% | ||||
| Dams / Canals / Marine Work | 4.688 | -7.5% | -23.2% | -35.8% | ||||
| Power Infrastructure | 2.183 | -68.0% | -83.3% | -59.6% | ||||
| Roads | 40.511 | -2.6% | -26.1% | -18.8% | ||||
| Water and Sewage Treatment | 18.686 | -0.2% | -10.9% | -20.9% | ||||
| CIVIL | 97.079 | -9.4% | -14.8% | -17.9% | ||||
| Offices (private) | 12.120 | -39.2% | -73.6% | -40.8% | ||||
| Parking Garages | 1.077 | -50.4% | -74.3% | -36.6% | ||||
| Transportation Terminals | 1.356 | -83.3% | -92.6% | -46.6% | ||||
| Commercial (small subset) | 14.552 | -51.8% | -79.5% | -41.2% | ||||
| Amusement | 3.683 | -20.8% | -74.6% | -39.7% | ||||
| Libraries / Museums | 2.770 | 17.6% | -52.3% | -24.3% | ||||
| Religious | 0.886 | -23.5% | -44.0% | -17.0% | ||||
| Sports Arenas / Convention Centers | 2.831 | -41.0% | -47.7% | 36.4% | ||||
| Community | 10.170 | -21.5% | -59.5% | -10.5% | ||||
| College / University | 10.574 | -12.9% | 22.9% | -15.5% | ||||
| Elementary / Pre School | 13.829 | -8.6% | -30.0% | -58.5% | ||||
| Jr / Sr High School | 18.036 | -19.7% | -27.7% | -34.5% | ||||
| Special / Vocational | 1.076 | -15.4% | -54.0% | -64.2% | ||||
| Educational | 43.515 | -14.7% | -19.2% | -40.5% | ||||
| Courthouses | 0.998 | 63.7% | -26.5% | 5.8% | ||||
| Fire and Police Stations | 1.779 | -3.5% | 42.2% | 29.4% | ||||
| Government Offices | 5.878 | -12.2% | -44.9% | 11.8% | ||||
| Prisons | 1.162 | 14.0% | -9.2% | -48.8% | ||||
| Government | 9.818 | -3.4% | -34.7% | 3.9% | ||||
| Industrial Labs / Labs / School Labs | 1.232 | 11.5% | 59.1% | -11.5% | ||||
| Manufacturing | 7.884 | -77.5% | -88.2% | 107.2% | ||||
| Warehouses | 12.263 | -2.4% | -44.8% | -55.5% | ||||
| Industrial | 21.378 | -56.1% | -79.8% | -23.0% | ||||
| Hospitals / Clinics | 6.460 | -39.5% | -84.0% | -48.3% | ||||
| Medical Misc. | 3.738 | -33.5% | -56.9% | -34.9% | ||||
| Nursing Homes | 3.422 | -43.5% | -61.1% | -28.9% | ||||
| Medical | 13.621 | -39.1% | -76.5% | -40.8% | ||||
| Military | 5.350 | 154.6% | 107.3% | 39.8% | ||||
| Hotels | 7.143 | -45.8% | -49.7% | 58.9% | ||||
| Retail Misc. | 3.082 | -24.2% | -38.6% | -23.8% | ||||
| Shopping | 7.252 | -32.1% | -26.2% | -11.6% | ||||
| Retail | 17.477 | -37.4% | -39.2% | 2.8% | ||||
| NONRESIDENTIAL BUILDING | 135.882 | -33.9% | -57.3% | -27.4% | ||||
| Multi-Family | 39.445 | -22.0% | -34.3% | -21.4% | ||||
| Single-Family | 108.539 | -6.2% | -15.8% | -10.3% | ||||
| RESIDENTIAL | 147.984 | -11.0% | -20.6% | -13.0% | ||||
| NONRESIDENTIAL | 232.960 | -25.5% | -44.0% | -23.1% | ||||
| GRAND TOTAL | 380.944 | -20.4% | -36.3% | -19.3% | ||||
Table 2 conforms to the type-of-structure ordering adopted by many firms and organizations in the industry. Specifically, it breaks nonresidential building into ICI work (i.e., industrial, commercial, and institutional), since each has its own set of economic and demographic drivers. Table 3 presents an alternative, perhaps more user-friendly and intuitive type-of-structure ordering that matches how the data appears in ConstructConnect Insight.
Source: ConstructConnect.
Table: ConstructConnect.
TABLE 4: VALUE OF UNITED STATES NATIONAL CONSTRUCTION STARTS – JULY 2020 – CONSTRUCTCONNECT
Billions of current $s, not seasonally adjusted (NSA)
| LATEST MONTH ACTUALS | MOVING AVERAGES (PLACED IN END MONTH) | YEAR TO DATE. | |||||||||
| 3-MONTHS | 12-MONTHS | JAN-JUL | JAN-JUL | ||||||||
| MAY 20 | JUN 20 | JUL 20 | MAY 20 | JUN 20 | JUL 20 | MAY 20 | JUN 20 | JUL 20 | 2019 | 2020 | |
| Single Family | 13.998 | 17.224 | 15.445 | 14.726 | 14.925 | 15.556 | 16.286 | 16.211 | 15.970 | 115.683 | 108.539 |
| month-over-month % change | 3.3% | 23.0% | -10.3% | -5.2% | 1.4% | 4.2% | -1.6% | -0.5% | -1.5% | ||
| year-over-year % change | -18.2% | -5.0% | -15.8% | -14.0% | -16.2% | -12.9% | 0.6% | 0.5% | -1.1% | -7.0% | -6.2% |
| Apartment | 5.342 | 5.447 | 4.283 | 5.529 | 5.223 | 5.024 | 7.679 | 7.467 | 7.281 | 50.553 | 39.445 |
| month-over-month % change | 9.5% | 2.0% | -21.4% | -3.2% | -5.5% | -3.8% | -0.3% | -2.8% | -2.5% | ||
| year-over-year % change | -5.1% | -31.8% | -34.3% | -22.6% | -27.8% | -25.2% | -1.3% | -3.1% | -4.4% | -5.2% | -22.0% |
| TOTAL RESIDENTIAL | 19.340 | 22.670 | 19.728 | 20.255 | 20.148 | 20.580 | 23.965 | 23.678 | 23.250 | 166.235 | 147.984 |
| month-over-month % change | 4.9% | 17.2% | -13.0% | -4.7% | -0.5% | 2.1% | -1.2% | -1.2% | -1.8% | ||
| year-over-year % change | -15.0% | -13.2% | -20.6% | -16.5% | -19.5% | -16.2% | 0.0% | -0.7% | -2.1% | -6.5% | -11.0% |
| Hotel/Motel | 0.431 | 0.485 | 0.771 | 0.826 | 0.618 | 0.562 | 1.629 | 1.514 | 1.450 | 13.174 | 7.143 |
| month-over-month % change | -54.0% | 12.5% | 58.9% | -36.8% | -25.2% | -9.0% | -6.1% | -7.1% | -4.2% | ||
| year-over-year % change | -74.5% | -74.1% | -49.7% | -61.5% | -66.3% | -66.9% | -14.8% | -21.4% | -24.0% | -20.3% | -45.8% |
| Retail | 0.926 | 1.001 | 0.885 | 1.125 | 1.033 | 0.937 | 1.178 | 1.113 | 1.086 | 10.683 | 7.252 |
| month-over-month % change | -21.0% | 8.1% | -11.6% | 3.2% | -8.2% | -9.3% | -5.0% | -5.5% | -2.3% | ||
| year-over-year % change | -44.3% | -43.8% | -26.2% | -26.1% | -37.6% | -39.4% | -19.5% | -25.7% | -25.0% | -8.0% | -32.1% |
| Parking Garages | 0.204 | 0.144 | 0.091 | 0.139 | 0.140 | 0.147 | 0.210 | 0.194 | 0.172 | 2.170 | 1.077 |
| month-over-month % change | 186.5% | -29.6% | -36.6% | 45.2% | 0.4% | 4.8% | -6.4% | -7.7% | -11.3% | ||
| year-over-year % change | -45.7% | -57.4% | -74.3% | -60.4% | -59.3% | -58.9% | -18.5% | -28.8% | -39.2% | 32.4% | -50.4% |
| Amusement | 0.342 | 0.513 | 0.309 | 0.541 | 0.517 | 0.388 | 0.645 | 0.627 | 0.551 | 4.648 | 3.683 |
| month-over-month % change | -50.9% | 50.2% | -39.7% | -10.5% | -4.4% | -24.9% | -2.1% | -2.9% | -12.1% | ||
| year-over-year % change | -32.7% | -30.2% | -74.6% | -4.9% | -16.2% | -52.7% | -1.7% | -2.4% | -21.9% | -2.0% | -20.8% |
| Office | 0.764 | 1.523 | 0.901 | 1.205 | 1.358 | 1.063 | 2.830 | 2.569 | 2.360 | 19.925 | 12.120 |
| month-over-month % change | -57.3% | 99.4% | -40.8% | -41.0% | 12.7% | -21.8% | -3.4% | -9.2% | -8.1% | ||
| year-over-year % change | -60.9% | -67.3% | -73.6% | -62.8% | -58.6% | -68.2% | 16.7% | -5.2% | -6.3% | 1.7% | -39.2% |
| Governmental Offices | 0.779 | 0.850 | 0.950 | 0.906 | 0.845 | 0.860 | 0.982 | 0.964 | 0.899 | 6.693 | 5.878 |
| month-over-month % change | -14.0% | 9.0% | 11.8% | 4.2% | -6.7% | 1.8% | -1.0% | -1.9% | -6.7% | ||
| year-over-year % change | -13.3% | -20.4% | -44.9% | 7.5% | -12.9% | -30.1% | 6.7% | 4.7% | -9.6% | 15.8% | -12.2% |
| Laboratories | 0.076 | 0.181 | 0.161 | 0.101 | 0.109 | 0.139 | 0.198 | 0.205 | 0.210 | 1.105 | 1.232 |
| month-over-month % change | 11.2% | 138.0% | -11.5% | -19.0% | 7.2% | 28.2% | -4.9% | 3.2% | 2.4% | ||
| year-over-year % change | -61.9% | 73.9% | 59.1% | -51.5% | -34.6% | 3.1% | -12.8% | -6.1% | 16.7% | -40.4% | 11.5% |
| Warehouse | 1.940 | 1.907 | 0.848 | 1.828 | 2.038 | 1.565 | 1.910 | 1.883 | 1.826 | 12.563 | 12.263 |
| month-over-month % change | -14.4% | -1.7% | -55.5% | 17.5% | 11.5% | -23.2% | 1.5% | -1.4% | -3.0% | ||
| year-over-year % change | 21.2% | -14.2% | -44.8% | -9.5% | -11.0% | -12.4% | 6.0% | 1.6% | 1.7% | -1.6% | -2.4% |
| Misc Commercial | 0.370 | 0.654 | 0.698 | 0.491 | 0.488 | 0.574 | 1.142 | 1.154 | 0.980 | 12.924 | 4.188 |
| month-over-month % change | -15.8% | 76.5% | 6.8% | -14.0% | -0.6% | 17.6% | -25.2% | 1.0% | -15.0% | ||
| year-over-year % change | -92.6% | 27.9% | -74.9% | -79.4% | -76.6% | -79.2% | -17.0% | -7.1% | -24.5% | 34.2% | -67.6% |
| TOTAL COMMERCIAL | 5.833 | 7.257 | 5.615 | 7.163 | 7.145 | 6.235 | 10.724 | 10.222 | 9.535 | 83.884 | 54.836 |
| month-over-month % change | -30.1% | 24.4% | -22.6% | -13.3% | -0.2% | -12.7% | -5.9% | -4.7% | -6.7% | ||
| year-over-year % change | -58.0% | -45.4% | -59.5% | -46.1% | -46.1% | -54.4% | -2.9% | -9.4% | -14.3% | -0.3% | -34.6% |
| TOTAL INDUSTRIAL (Manufacturing) | 2.157 | 0.460 | 0.954 | 1.160 | 1.087 | 1.190 | 2.962 | 2.919 | 2.326 | 35.056 | 7.884 |
| month-over-month % change | 235.4% | -78.7% | 107.2% | 20.6% | -6.3% | 9.5% | -22.7% | -1.5% | -20.3% | ||
| year-over-year % change | -82.9% | -52.9% | -88.2% | -82.6% | -79.1% | -83.5% | -19.5% | -18.4% | -43.9% | 65.8% | -77.5% |
| Religious | 0.123 | 0.095 | 0.079 | 0.156 | 0.096 | 0.099 | 0.149 | 0.139 | 0.134 | 1.157 | 0.886 |
| month-over-month % change | 73.7% | -22.6% | -17.0% | 3.1% | -38.0% | 2.9% | -3.8% | -6.3% | -3.7% | ||
| year-over-year % change | -36.6% | -54.3% | -44.0% | -6.6% | -47.3% | -45.3% | -16.6% | -18.5% | -21.7% | -10.3% | -23.5% |
| Hosptials/Clinics | 1.146 | 0.916 | 0.474 | 0.815 | 0.917 | 0.845 | 1.694 | 1.609 | 1.401 | 10.678 | 6.460 |
| month-over-month % change | 66.3% | -20.1% | -48.3% | -12.1% | 12.4% | -7.8% | 0.1% | -5.0% | -12.9% | ||
| year-over-year % change | 1.7% | -52.7% | -84.0% | -30.7% | -29.1% | -58.0% | 35.5% | 23.6% | -4.9% | 8.1% | -39.5% |
| Nursing/Assisted Living | 0.473 | 0.372 | 0.264 | 0.537 | 0.486 | 0.369 | 0.631 | 0.611 | 0.577 | 6.061 | 3.422 |
| month-over-month % change | -23.1% | -21.4% | -28.9% | 4.4% | -9.5% | -24.0% | -5.8% | -3.2% | -5.6% | ||
| year-over-year % change | -49.8% | -39.7% | -61.1% | -43.3% | -39.6% | -50.4% | -28.8% | -28.9% | -32.1% | -6.5% | -43.5% |
| Libraries/Museums | 0.347 | 0.296 | 0.224 | 0.264 | 0.301 | 0.289 | 0.397 | 0.392 | 0.371 | 2.354 | 2.770 |
| month-over-month % change | 33.6% | -14.6% | -24.3% | -33.1% | 14.0% | -3.9% | -3.5% | -1.2% | -5.2% | ||
| year-over-year % change | -33.3% | -16.4% | -52.3% | -34.5% | -24.5% | -35.5% | 50.1% | 43.9% | 25.2% | 52.4% | 17.6% |
| Police/Courthouse/Prison | 0.424 | 0.499 | 0.451 | 0.542 | 0.482 | 0.458 | 0.621 | 0.612 | 0.614 | 3.473 | 3.939 |
| month-over-month % change | -18.8% | 17.8% | -9.7% | -0.6% | -11.1% | -4.9% | -2.1% | -1.5% | 0.4% | ||
| year-over-year % change | -27.2% | -18.4% | 7.4% | 0.8% | -16.8% | -14.9% | -4.7% | -4.4% | 2.1% | -20.5% | 13.4% |
| Military | 0.488 | 0.530 | 0.742 | 1.044 | 0.991 | 0.587 | 0.655 | 0.669 | 0.701 | 2.101 | 5.350 |
| month-over-month % change | -75.1% | 8.7% | 39.8% | 6.2% | -5.1% | -40.8% | 2.7% | 2.2% | 4.8% | ||
| year-over-year % change | 75.6% | 47.8% | 107.3% | 234.7% | 244.0% | 77.0% | 57.0% | 60.5% | 68.7% | -10.5% | 154.6% |
| Schools/Colleges | 7.034 | 9.264 | 5.511 | 6.674 | 7.405 | 7.269 | 5.980 | 5.795 | 5.686 | 51.010 | 43.515 |
| month-over-month % change | 18.9% | 31.7% | -40.5% | 17.3% | 10.9% | -1.8% | -2.1% | -3.1% | -1.9% | ||
| year-over-year % change | -18.2% | -19.4% | -19.2% | -12.6% | -21.3% | -18.9% | -4.1% | -8.7% | -10.2% | 9.6% | -14.7% |
| Misc Government | 0.786 | 0.409 | 0.266 | 0.684 | 0.594 | 0.487 | 0.705 | 0.650 | 0.621 | 5.621 | 3.738 |
| month-over-month % change | 34.1% | -48.0% | -34.9% | 21.2% | -13.1% | -18.0% | -3.1% | -7.8% | -4.5% | ||
| year-over-year % change | -25.7% | -61.6% | -56.9% | -21.7% | -41.9% | -46.7% | -20.6% | -24.3% | -25.5% | -18.2% | -33.5% |
| TOTAL INSTITUTIONAL | 10.820 | 12.381 | 8.010 | 10.716 | 11.272 | 10.404 | 10.831 | 10.477 | 10.105 | 82.456 | 70.081 |
| month-over-month % change | 1.9% | 14.4% | -35.3% | 9.7% | 5.2% | -7.7% | -1.9% | -3.3% | -3.5% | ||
| year-over-year % change | -18.6% | -25.6% | -35.8% | -11.1% | -19.4% | -26.4% | 0.5% | -3.6% | -7.9% | 4.0% | -15.0% |
| Misc Non Residential | 0.370 | 0.484 | 0.369 | 0.412 | 0.419 | 0.408 | 0.585 | 0.574 | 0.555 | 4.067 | 3.082 |
| month-over-month % change | -7.8% | 30.7% | -23.8% | -4.5% | 1.7% | -2.6% | -3.1% | -1.9% | -3.4% | ||
| year-over-year % change | -38.0% | -21.3% | -38.6% | -32.5% | -33.6% | -32.5% | -2.3% | -1.3% | -1.8% | -9.5% | -24.2% |
| TOTAL NONRES BUILDING | 19.180 | 20.583 | 14.948 | 19.450 | 19.923 | 18.237 | 25.102 | 24.191 | 22.520 | 205.463 | 135.882 |
| month-over-month % change | -4.1% | 7.3% | -27.4% | 0.1% | 2.4% | -8.5% | -6.6% | -3.6% | -6.9% | ||
| year-over-year % change | -52.5% | -34.7% | -57.3% | -40.4% | -39.7% | -48.8% | -3.8% | -8.0% | -16.0% | 8.7% | -33.9% |
| Airports | 0.539 | 0.886 | 0.803 | 0.461 | 0.578 | 0.743 | 0.532 | 0.556 | 0.536 | 4.369 | 3.420 |
| month-over-month % change | 74.4% | 64.3% | -9.4% | 34.5% | 25.3% | 28.5% | -2.1% | 4.6% | -3.6% | ||
| year-over-year % change | -20.6% | 49.9% | -22.9% | -9.8% | -4.2% | -3.6% | -5.3% | -3.6% | -12.3% | 1.7% | -21.7% |
| Roads/Highways | 6.774 | 7.159 | 5.816 | 6.665 | 7.201 | 6.583 | 5.482 | 5.521 | 5.349 | 41.603 | 40.511 |
| month-over-month % change | -11.7% | 5.7% | -18.8% | 18.0% | 8.0% | -8.6% | -0.9% | 0.7% | -3.1% | ||
| year-over-year % change | -7.8% | 7.0% | -26.1% | 1.5% | 2.1% | -9.9% | 4.2% | 3.9% | -0.3% | 2.8% | -2.6% |
| Bridges | 1.981 | 2.715 | 1.712 | 2.229 | 2.143 | 2.136 | 2.148 | 2.184 | 2.160 | 19.510 | 15.249 |
| month-over-month % change | 14.3% | 37.1% | -36.9% | 0.9% | -3.8% | -0.3% | -1.1% | 1.7% | -1.1% | ||
| year-over-year % change | -12.3% | 18.9% | -14.4% | -36.5% | -42.4% | -2.1% | -10.3% | -8.9% | -10.5% | 33.7% | -21.8% |
| Dams/Marine | 0.885 | 0.663 | 0.426 | 0.781 | 0.785 | 0.658 | 0.728 | 0.692 | 0.681 | 5.068 | 4.688 |
| month-over-month % change | 9.7% | -25.1% | -35.8% | 33.3% | 0.6% | -16.2% | -11.9% | -5.0% | -1.5% | ||
| year-over-year % change | -57.0% | -39.9% | -23.2% | -13.2% | -33.3% | -46.9% | 11.1% | -3.2% | -5.0% | 62.8% | -7.5% |
| Water/Sewage | 2.297 | 3.425 | 2.709 | 2.815 | 2.897 | 2.811 | 2.589 | 2.660 | 2.633 | 18.715 | 18.686 |
| month-over-month % change | -22.6% | 49.1% | -20.9% | 3.2% | 2.9% | -3.0% | -1.9% | 2.8% | -1.0% | ||
| year-over-year % change | -21.0% | 33.5% | -10.9% | 2.2% | -1.6% | -1.0% | 7.7% | 10.2% | 7.5% | -1.3% | -0.2% |
| Misc Civil | 3.809 | 1.795 | 2.198 | 2.228 | 2.285 | 2.601 | 3.921 | 3.516 | 3.572 | 17.859 | 14.525 |
| month-over-month % change | 204.6% | -52.9% | 22.4% | 73.4% | 2.6% | 13.8% | -1.1% | -10.3% | 1.6% | ||
| year-over-year % change | -11.8% | -73.0% | 43.1% | -16.2% | -46.1% | -37.6% | 97.8% | 54.0% | 51.8% | -17.9% | -18.7% |
| TOTAL ENGINEERING | 16.285 | 16.644 | 13.665 | 15.179 | 15.888 | 15.531 | 15.400 | 15.130 | 14.931 | 107.123 | 97.079 |
| month-over-month % change | 10.5% | 2.2% | -17.9% | 18.6% | 4.7% | -2.2% | -1.7% | -1.8% | -1.3% | ||
| year-over-year % change | -16.8% | -16.3% | -14.8% | -10.2% | -19.5% | -16.1% | 16.2% | 10.4% | 7.3% | 3.8% | -9.4% |
| GRAND TOTAL | 54.805 | 59.897 | 48.340 | 54.884 | 55.959 | 54.348 | 64.467 | 62.999 | 60.701 | 478.822 | 380.944 |
| month-over-month % change | 3.1% | 9.3% | -19.3% | 2.6% | 2.0% | -2.9% | -3.5% | -2.3% | -3.6% | ||
| year-over-year % change | -33.7% | -22.7% | -36.3% | -25.6% | -28.1% | -30.9% | 1.8% | -1.3% | -5.9% | 1.9% | -20.4% |
| NONRES BLDG + ENGINEERING | 35.465 | 37.227 | 28.612 | 34.629 | 35.811 | 33.768 | 40.502 | 39.321 | 37.451 | 312.586 | 232.960 |
| month-over-month % change | 2.1% | 5.0% | -23.1% | 7.5% | 3.4% | -5.7% | -4.8% | -2.9% | -4.8% | ||
| year-over-year % change | -40.8% | -27.6% | -44.0% | -30.1% | -32.2% | -37.6% | 2.9% | -1.7% | -8.0% | 6.9% | -25.5% |
Data Source and Table: ConstructConnect.
TABLE 5: U.S. YEAR-TO-DATE REGIONAL STARTS
NONRESIDENTIAL CONSTRUCTION* — CONSTRUCTCONNECT
| JAN-JUL 2019 | JAN-JUL 2020 | % CHANGE | |||
| Connecticut | $3,674,262,830 | $2,308,211,734 | -37.2% | ||
| Maine | $1,134,917,790 | $1,002,628,466 | -11.7% | ||
| Massachusetts | $8,251,934,918 | $5,092,443,402 | -38.3% | ||
| New Hampshire | $969,657,247 | $610,549,289 | -37.0% | ||
| Rhode Island | $634,738,443 | $460,318,632 | -27.5% | ||
| Vermont | $268,181,442 | $421,509,080 | 57.2% | ||
| Total New England | $14,933,692,670 | $9,895,660,603 | -33.7% | ||
| New Jersey | $4,415,578,144 | $4,143,733,347 | -6.2% | ||
| New York | $14,204,223,177 | $11,755,417,263 | -17.2% | ||
| Pennsylvania | $10,533,706,760 | $6,060,951,356 | -42.5% | ||
| Total Middle Atlantic | $29,153,508,081 | $21,960,101,966 | -24.7% | ||
| TOTAL NORTHEAST | $44,087,200,751 | $31,855,762,569 | -27.7% | ||
| Illinois | $8,687,163,591 | $9,665,764,655 | 11.3% | ||
| Indiana | $4,940,608,798 | $4,922,097,424 | -0.4% | ||
| Michigan | $5,808,405,849 | $4,544,331,536 | -21.8% | ||
| Ohio | $9,020,939,192 | $7,127,079,724 | -21.0% | ||
| Wisconsin | $6,740,227,592 | $5,542,751,089 | -17.8% | ||
| Total East North Central | $35,197,345,022 | $31,802,024,428 | -9.6% | ||
| Iowa | $3,327,595,389 | $3,534,406,041 | 6.2% | ||
| Kansas | $3,267,363,970 | $2,605,053,027 | -20.3% | ||
| Minnesota | $7,506,857,771 | $5,288,860,241 | -29.5% | ||
| Missouri | $5,558,586,129 | $7,150,338,198 | 28.6% | ||
| Nebraska | $2,522,472,880 | $2,950,768,770 | 17.0% | ||
| North Dakota | $1,432,284,787 | $1,394,813,618 | -2.6% | ||
| South Dakota | $1,245,007,008 | $868,670,143 | -30.2% | ||
| Total West North Central | $24,860,167,934 | $23,792,910,038 | -4.3% | ||
| TOTAL MIDWEST | $60,057,512,956 | $55,594,934,466 | -7.4% | ||
| Delaware | $751,247,444 | $841,917,883 | 12.1% | ||
| District of Columbia | $1,378,513,014 | $517,673,778 | -62.4% | ||
| Florida | $18,351,383,318 | $13,175,834,635 | -28.2% | ||
| Georgia | $12,767,069,730 | $6,271,153,978 | -50.9% | ||
| Maryland | $4,705,415,811 | $4,546,299,157 | -3.4% | ||
| North Carolina | $8,516,233,203 | $6,232,363,612 | -26.8% | ||
| South Carolina | $4,386,631,485 | $3,063,175,925 | -30.2% | ||
| Virginia | $10,005,974,126 | $6,491,889,571 | -35.1% | ||
| West Virginia | $1,054,284,482 | $1,651,851,532 | 56.7% | ||
| Total South Atlantic | $61,916,752,613 | $42,792,160,071 | -30.9% | ||
| Alabama | $6,483,747,523 | $3,137,987,959 | -51.6% | ||
| Kentucky | $4,274,739,096 | $1,914,670,265 | -55.2% | ||
| Mississippi | $1,661,966,230 | $1,859,698,810 | 11.9% | ||
| Tennessee | $5,559,208,992 | $4,560,536,377 | -18.0% | ||
| Total East South Central | $17,979,661,841 | $11,472,893,411 | -36.2% | ||
| Arkansas | $2,039,788,285 | $2,310,970,716 | 13.3% | ||
| Louisiana | $6,827,825,304 | $2,610,953,865 | -61.8% | ||
| Oklahoma | $3,290,196,953 | $2,279,591,885 | -30.7% | ||
| Texas | $48,508,826,041 | $26,223,465,604 | -45.9% | ||
| Total West South Central | $60,666,636,583 | $33,424,982,070 | -44.9% | ||
| TOTAL SOUTH | $140,563,051,037 | $87,690,035,552 | -37.6% | ||
| Arizona | $5,533,948,093 | $4,911,382,861 | -11.2% | ||
| Colorado | $5,992,468,460 | $4,240,118,093 | -29.2% | ||
| Idaho | $1,473,729,976 | $922,313,645 | -37.4% | ||
| Montana | $882,296,471 | $900,049,558 | 2.0% | ||
| Nevada | $3,902,632,047 | $2,416,304,697 | -38.1% | ||
| New Mexico | $894,736,417 | $1,503,850,330 | 68.1% | ||
| Utah | $3,588,915,135 | $4,350,733,079 | 21.2% | ||
| Wyoming | $3,789,098,641 | $744,243,967 | -80.4% | ||
| Total Mountain | $26,057,825,240 | $19,988,996,230 | -23.3% | ||
| Alaska | $732,057,529 | $777,865,926 | 6.3% | ||
| California | $24,646,907,418 | $23,810,727,691 | -3.4% | ||
| Hawaii | $1,583,531,834 | $1,098,355,518 | -30.6% | ||
| Oregon | $3,695,838,889 | $2,789,207,751 | -24.5% | ||
| Washington | $11,162,429,749 | $9,354,210,045 | -16.2% | ||
| Total Pacific | $41,820,765,419 | $37,830,366,931 | -9.5% | ||
| TOTAL WEST | $67,878,590,659 | $57,819,363,161 | -14.8% | ||
| TOTAL U.S. | $312,586,355,403 | $232,960,095,748 | -25.5% |
*Figures above are comprised of nonres building and engineering (i.e., residential is omitted).
Data Source and Table: ConstructConnect












Recent Comments